Deploying a CI/CD pipeline is only a half success. To complete the deployment, you need to establish continuous monitoring and observability which will allow you to collect metrics and actionable insights. In this blogpost you will learn about the principles of monitoring and observability, how they are related and how automation can streamline the entire deployment process.
DevOps model
DevOps culture is a good starting point here, as understanding its principles will allow you to contextualize continuous monitoring and observability. From a business perspective, the DevOps lifecycle is there to improve communication and collaboration among stakeholders in order to increase the speed and quality of software deployment and thus shorten the time to market of new features. The DevOps model can be broken down into five key areas that should be considered as principles or best practices for proper implementation of a CI/CD process. They include:
- Destroy communication siloses between teams
- Accept failure as a normal occurrence
- Implement changes gradually
- Leverage tooling and automation
- Measure everything

Continuous monitoring and observability for a CI/CD pipeline
Despite obvious business advantages, a rapid release approach combined with continuous change processes resulting from DevOps principles will in the long run generate new challenges. The entire process should be carefully examined and controlled. Neglecting this aspect can cost you dearly. A way to mitigate this risk is to implement a Continuous Monitoring and Observability (CM) solution—the final capability for a CI/CD pipeline. By invoking the DevOps “measure everything” principle, a CM will allow you to take advantage of the following features:
- Analyzing long-term trends: How many builds am I running daily? How many did I run a month ago? Do I need to scale my infrastructure up or down?
- Over-time comparison: Is my deployment slower than it was last week? Or is it faster?
- Vulnerability scans: Does my code introduce any critical software faults and security vulnerabilities such as memory leaks, uninitialized variables, array-boundary? How rapidly are they detected? How quickly are they fixed?
- Alerting: Is something broken, or might break soon? Did my test pipeline pass? Should I perform a rollback on my latest deployment?
- Conducting ad-hoc retrospective analysis: My latency just shot up, what else happened around the same time? Are those events related to each other?
Continuous monitoring and observability should be considered the backbone of your CI/CD pipeline, as they help to ensure the health, performance, and reliability of your applications and infrastructure across each phase of your DevOps and IT operations lifecycles.
-> Want to learn more about CI/CD? Check out our other articles:
- What is CI/CD - all you need to know
- How to set up and optimize a CI/CD pipeline
- Best CI/CD pipeline tools you should know
- CI/CD process—how to handle it
- Business benefits of CI/CD
- Sharing configuration between your CI, build and development environments
- How to build a test automation framework in the cloud
Monitoring vs observability
No proper discussion on monitoring can be complete without contrasting it with observability. To be sure, observability isn’t a substitute for monitoring. Nor does it obviate the need for monitoring. They are complementary and aim to achieve different goals.
Monitoring consists in collecting, processing, aggregating and displaying real-time quantitative data about a system to gain visibility on its health and resolve eventual problems. These data come in different types: query counts and types, error counts and types, processing times, events, traces, and server lifetimes. Yet the importance of monitoring goes well beyond that, as it allows you to translate metrics generated by your systems and applications into business value. When done right, monitoring can provide you with measurable insights on the user experience which in turn can be applied to business to ensure that customers get what they really want.
Observability is a property that allows you to diagnose your system’s internal state by knowing its external outputs. Such a system has been designed, built, tested, deployed, operated, monitored, maintained, and evolved with the following assumptions in mind:
- No complex system is ever fully healthy.
- Distributed systems are unpredictable.
- It’s impossible to predict all the possible failures the system may experience.
- Failures need to be embraced as normal at every phase of the software development lifecycle.
- Ease of debugging is a cornerstone of the maintenance and evolution of robust systems.
With all this in mind, we can safely say that observability must be considered at the early phase of the system design process in order to provide highly granular insights into the behavior of systems along with rich context, which is conducive to debugging.
Monitoring and observability
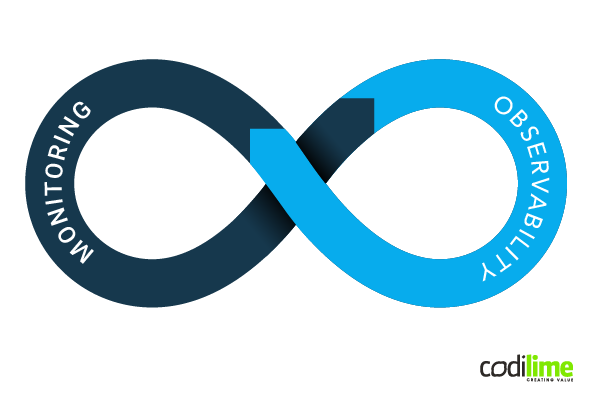
As you can see from the definitions, observability can be seen as a superset of monitoring. It provides not only high-level overviews of the health of your system, but also highly granular insights into its implicit failure modes. Additionally, an observable system furnishes ample context about its inner workings, unlocking the ability to uncover deeper, systemic issues.

Fig. 1 Continuous Monitoring and Observability in CI/CD
There is one more significant advantage of understanding that both monitoring and observability are inseparable components: only after you’ve made the system observable, and after you’ve collected the data using a monitoring tool, can effective analysis be performed, either manually or automatically. Without meaningful analysis you fall short of the whole purpose of applying observability and performing monitoring in the first place. The more superior your analysis capabilities are, the more valuable your investments in observability and monitoring become.
Different approaches to monitoring
In assessing the maturity of a monitoring solution, you will often refer to terms such as “reactive” and “proactive” in order to evaluate them. This doesn’t necessarily mean that one of them is better than another. It’s rather a matter of determining the degree of complexity they require in order to implement them. If you aim for a highly effective solution, you should use a combination of both approaches by selecting their best features.
In the “pre-DevOps era”, reactive monitoring was built and deployed by an operations team. While the solution itself was mostly based on automation mechanisms, a fair number of system or application components remained untrackable, forcing the operators to perform manual actions. These included writing custom scripts, which later became hard to track and maintain. Large notifications backlogs, alerting rules based on simple thresholds, stale check configuration and architecture were commonly considered standard.
In the reactive approach, updates to monitoring systems are here a reaction to incidents and outages. This approach is therefore most useful after an incident happens, as it allows you to capture and store real-time metrics. These metrics are later used to investigate historical data and analyze it. Based on the outcome of this analysis, preventive measures are introduced to prohibit the recurrence of this incident.
Proactive monitoring, on the other hand, is commonly acknowledged by organisations that have already adopted the DevOps culture, which is typical for web-centric organizations like Netflix and Amazon, as well as for many startups.
Proactive monitoring is still mainly performed by an operations team. However, the responsibility for ensuring new applications and services are monitored properly should be delegated to developers. It is they who have the best insights about the products they are creating. In fact, products should not be considered feature complete or ”production ready” without making sure they are observable and monitorable.
Including developers in defining the monitoring objectives will most probably lead to creating more application-centric checks, focusing on the performance and business outcome rather than just stock concerns like disc capacity or CPU utilization. Collected data will be used more frequently for analysis and fault resolution. Alerting will be annotated with context and will likely include escalations, automatic responses, playbooks describing how to fix the problem, or even trigger a self-healing capacity.
Proactiveness also brings additional value to the table for a reason that does not seem so obvious. It provides the opportunity to focus on measuring the quality of a service and customer experience. Data collected with a monitoring solution may be directly presented with the use of a visualisation tool to key stakeholders, for example business units or application teams. In the long run, these data can be used to justify budget expenses, costs or new projects.
Automation in continuous monitoring and observability
As automation is one of the key ingredients of an efficient CI/CD pipeline, it makes perfect sense to automate monitoring and observability too. The idea of continuous monitoring and observability is a logical corollary of the CI/CD philosophy. They must be automated in the same way integration, testing, and deployment have been automated. In highly dynamic and scalable environments, the entire monitoring process must be adapted to the constantly implemented changes without the need for manual intervention and configuration. To achieve that, we need to identify and prioritize the critical capabilities that our technology stack requires in order to be effective.
First comes automatic service registration and discovery (Consul, Apache Zookeeper, Eureka). This is a process of automatically detecting and registering services over a network. Service discovery protocol (SDP) is a networking standard that detects devices and services in the network. Traditionally, service discovery helps reduce the number of human errors committed during manual configuration. There are two types of service discovery: server-side and client-side. Server-side service discovery allows clients applications to find services through a router or a load balancer. Client-side service discovery allows clients applications to find services by looking through or querying a service registry, in which service instances and endpoints are all within the service registry.
Next there is automatic instrumentation and monitoring of application components (OpenTracing and OpenCensus, merged to form OpenTelemetry). Instrumentation is the process through which application code is extended to capture and report trace spans for the operations of interest in the path of handling a particular user request or transaction. Automatic instrumentation is commonly implemented by adding middleware that wraps certain significant pieces of code with instrumentation logic. A typical example is a middleware around an HTTP request that measures the time that has been spent producing a response as well as the information on both the request and response, such as status code and payloads. This gives you the ability to easily collect telemetry like metrics and distributed traces from your services.
Finally, there are automatic alerting of infrastructure and application performance problems (AlertManager, PagerDuty). An efficient alerting mechanism that augments the Continuous Integration and Continuous Delivery pipeline is crucial to support engineering and product velocity. They use built-in alerting to detect failures or anomalous conditions and combine alerts with webhooks to proactively solve problems when they’re detected.
Enabling automation into your CM solution will keep your CI/CD pipelines flowing smoothly and efficiently. You'll be able to deploy your code faster and with the confidence that your services are monitored, allowing your engineers to quickly resolve any incidents that arise over time.
Conclusion
With both the business environment and the technology landscape changing and growing rapidly, embracing DevOps will help your organization increase the speed and the quality of its software deployments by improving communication and collaboration among stakeholders. Continuous monitoring and observability provides visibility across your infrastructure and the entire CI/CD pipeline throughout the software development lifecycle, allowing you to understand the environment's health at any given time. This reduces the gaps between your development and operations teams, and that enables the DevOps culture.


